Average Stock Market Return: S&P 500 Historical Returns Explained
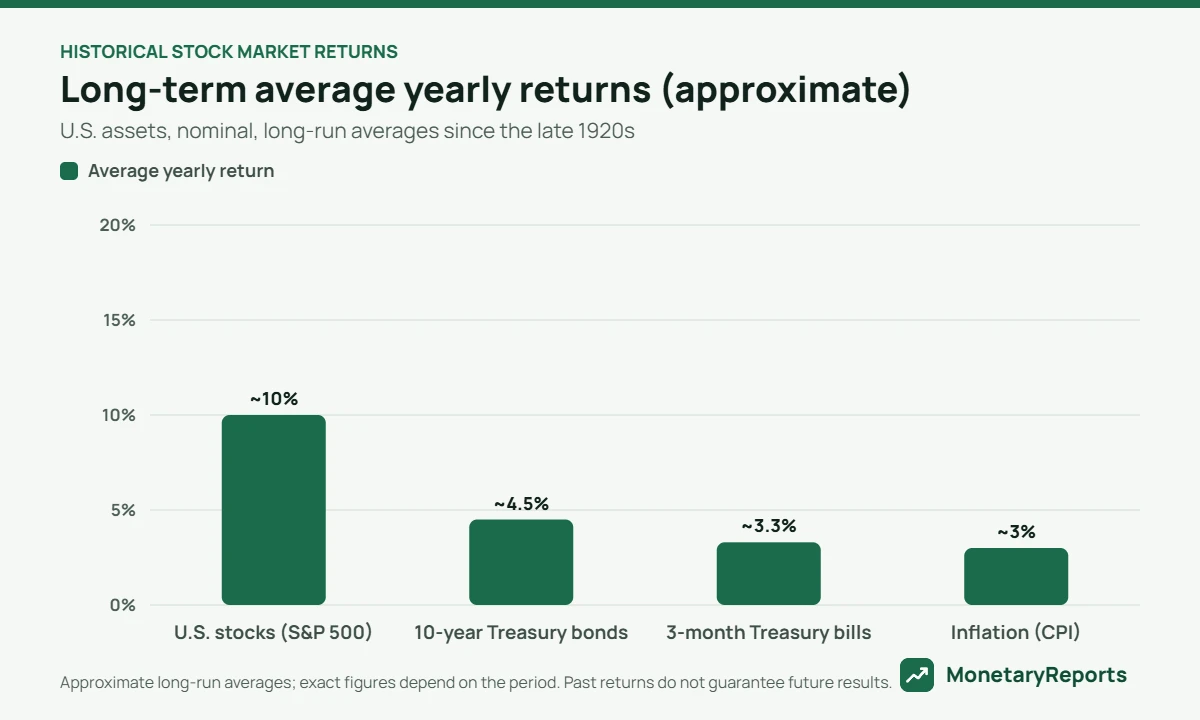
What are historical stock market returns, really? You often hear that stocks return “about 10% a year”. That is roughly the long-run average for large U.S. stocks before inflation, but the path is anything but smooth. This guide explains the numbers simply and what they mean for your planning.
Quick answer
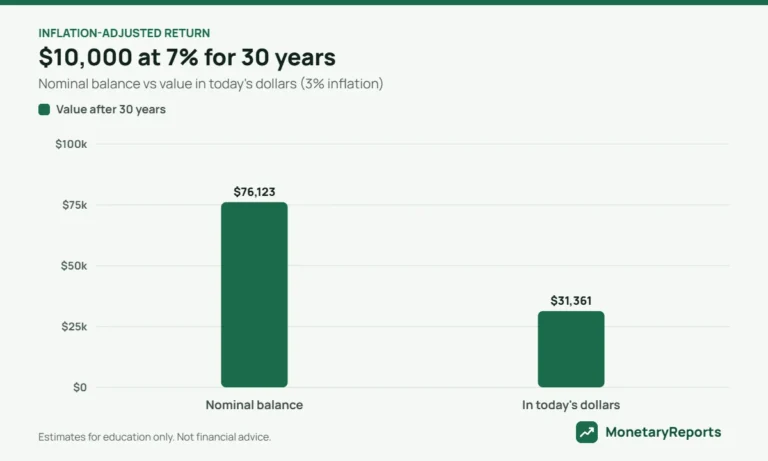
Over the long run, large U.S. stocks (the S&P 500 and its predecessors) have averaged roughly 10% a year before inflation and roughly 6% to 7% after inflation, with dividends reinvested. But single years have ranged from big losses to big gains, so returns are never guaranteed.
Historical stock market returns: the averages
| Asset | Approximate long-run yearly return (nominal) | What it means |
|---|---|---|
| U.S. large stocks | about 10% | Highest long-term growth, biggest swings |
| 10-year Treasury bonds | about 4% to 5% | Steadier, lower growth |
| 3-month Treasury bills (cash) | about 3% | Very stable, roughly keeps up with inflation |
| Inflation | about 3% | The hurdle every investment must clear |
The ups and downs
Average returns hide wild swings. Stocks have had several years with losses of more than 20%, and multi-year stretches of poor performance, such as the early 2000s. They have also had years with gains above 30%. Anyone investing in stocks should be ready for large temporary losses.
Average vs compound return
The simple average of yearly returns is higher than the compound (geometric) return you actually earn, because losses hurt more than gains help: a 50% loss needs a 100% gain to recover. That is why planners often use a lower number than the headline average. Our investment growth (CAGR) calculator shows the compound rate between two values.
Using history to plan
- Use a conservative planning rate, such as 5% to 7% for a stock-heavy portfolio, and test lower ones.
- Hold money you need within a few years in safer assets.
- Diversify across many companies with low-cost funds.
- Stay invested: missing a handful of the best days can sharply reduce long-term returns.
Interactive chart: hover or tap to see each year. Estimates only, before taxes and inflation.
What historical stock market returns mean for you
- Long time horizons have historically favored stocks, but with real risk along the way.
- Plan with cautious numbers and let any extra be a bonus.
- Your mix of stocks, bonds and cash should match when you need the money.
Frequently asked questions
What is the average stock market return?
Roughly 10% a year for large U.S. stocks over the long run before inflation, about 6% to 7% after inflation, with dividends reinvested.
Is 7% a realistic return?
It is a common long-term planning assumption for a stock-heavy portfolio. Real results may be higher or lower.
How often does the stock market lose money?
Historically, U.S. stocks have fallen in roughly one out of every four years, sometimes sharply.
Do past returns predict future returns?
No. History shows what has happened, not what will happen.
Where can I see historical return data?
Sources such as NYU Stern professor Aswath Damodaran publish yearly returns for stocks, bonds and bills.
Related guides and calculators
- Investing $500 a month for 30 years
- Dollar-cost averaging explained
- What is an inflation-adjusted return?
- Investment growth (CAGR) calculator
Sources
- NYU Stern (Damodaran): Historical returns on stocks, bonds and bills
- Investor.gov (U.S. SEC): Compound interest calculator
- U.S. Bureau of Labor Statistics: Consumer Price Index
- MonetaryReports: How we calculate
This guide is for educational purposes only and is not financial advice. The figures are estimates before taxes, fees and inflation, and real rates, returns and rules change over time.